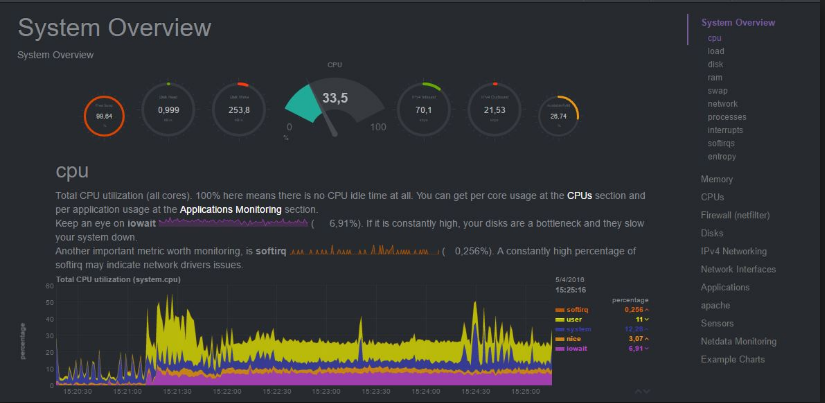
Netdata is an open-source monitoring and troubleshooting tool designed for real-time performance and health monitoring of servers, applications, and containers. It is known for its efficiency, as it collects and visualizes metrics in real-time with minimal impact on system resources. Netdata is particularly useful for quickly identifying and resolving performance issues.
Features of Netdata:
Real-time Visualization: Netdata provides real-time visualization of essential system and application metrics, allowing you to monitor the performance of your infrastructure instantly.
Extensive Metrics Support: It supports a wide range of metrics, including CPU usage, memory usage, disk I/O, network traffic, process monitoring, and more.
Easy Installation: Netdata is easy to install and can be set up quickly on various platforms, including Linux distributions, macOS, and FreeBSD.
Efficient Resource Usage: Netdata is designed to be lightweight and efficient, with low resource utilization, making it suitable for monitoring high-traffic servers and containers without impacting their performance.
Interactive Web Interface: The web-based interface of Netdata is interactive and provides real-time charts and graphs for easy visualization of metrics.
Alarm Notifications: Netdata allows you to set up alarms and notifications based on predefined thresholds. When a metric exceeds a certain limit, you can receive alerts via email, Slack, or other methods.
Container Monitoring: Netdata has built-in support for monitoring Docker containers, Kubernetes, and other containerization technologies, providing insights into container performance.
Out-of-the-Box Dashboards: Netdata comes with a set of pre-configured dashboards for various components, making it easy to get started with monitoring.
Remote Monitoring: You can use Netdata to monitor multiple systems from a centralized location, making it convenient for managing large-scale infrastructures.
Customizability: Netdata allows you to create custom dashboards and charts, tailoring the monitoring experience to your specific needs.
Netdata in Action:
Imagine you have a server running critical applications, and you want to ensure it’s performing optimally. By installing Netdata on the server, you can access its web interface through a browser. Here’s how Netdata works in action:
Real-Time Metrics: As soon as you access the Netdata web interface, you’ll see real-time charts displaying various metrics related to CPU, memory, disk, network, and more.
Interactive Interface: The interface is interactive, allowing you to zoom in on specific timeframes, hover over charts to view detailed information, and click on specific metrics to drill down further.
Alarms and Notifications: You can configure alarms for specific metrics. For example, if CPU usage exceeds 90%, Netdata can trigger an alert, allowing you to take action promptly.
Container Monitoring: If you have Docker containers running on the server, Netdata will automatically detect and monitor them, providing insights into container resource usage and performance.
Custom Dashboards: Netdata allows you to create custom dashboards to focus on the metrics that matter most to you and your applications.
Overall, Netdata’s real-time monitoring capabilities enable you to identify performance bottlenecks, troubleshoot issues, and optimize your infrastructure efficiently.

